How to debug
Introduction
There was a time when I was tasked to maintain a system, and fix it iteratively whenever users report bugs. I was not on building-mode: the priority isn’t the next killer feature or the next phase in the roadmap—it’s simply to ensure that the software is working as expected. During those weeks of squashing bugs and triaging errors, I realized that debugging isn’t as straightforward as I thought it was!
Debugging seems to be a skill expected from anyone entering into tech, but the knowledge on how to effectively do so is siloed-out. It makes sense because as you learn how to code, you’ve certainly hit errors and debugged your way out of it. Then, as we went through our own tech journeys, we developed a tacit knowledge1 on how to debug.
I realized that I don’t have a “mental framework” on how to debug effectively. Usually, I just rely on my tacit knowledge and practical experience.
I realized that I don’t have a “mental framework” on how to debug effectively. Usually, I just rely on my tacit knowledge and practical experience. Hence, I devised a short three-part framework for myself, and I’m sharing it to you through Pixel Art2!
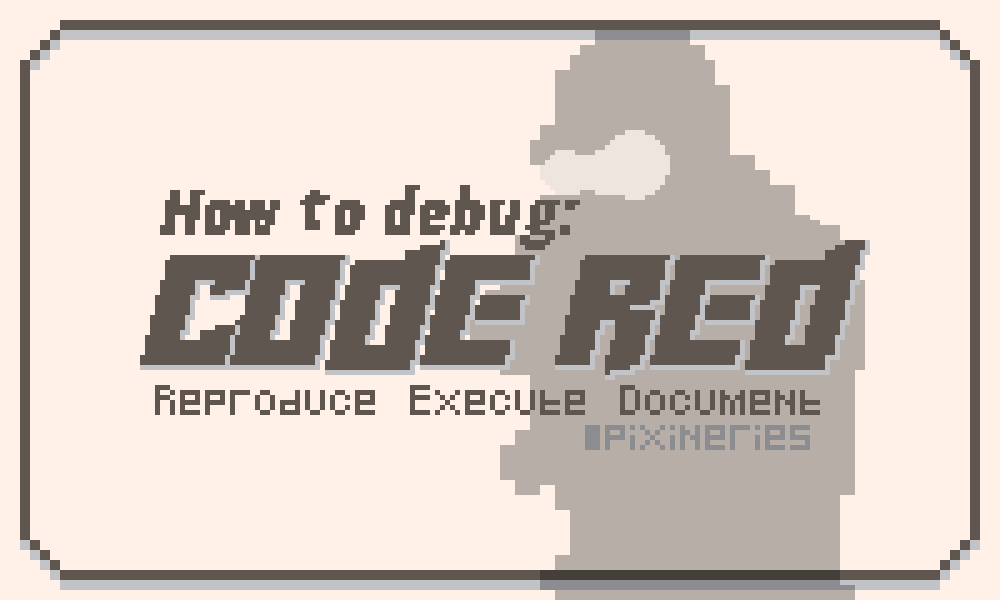
Code R.E.D.: my mental framework for debugging
The color red hints at urgency, just like those movie scenes where enemy aliens attack and emergency alarms are set off—that’s how I see the process of debugging.
R.E.D. is also an acronym for the mental framework that I’m trying to practice: it sounds nice, and on theme with my Space Force pixel art!
R is for Reproduce
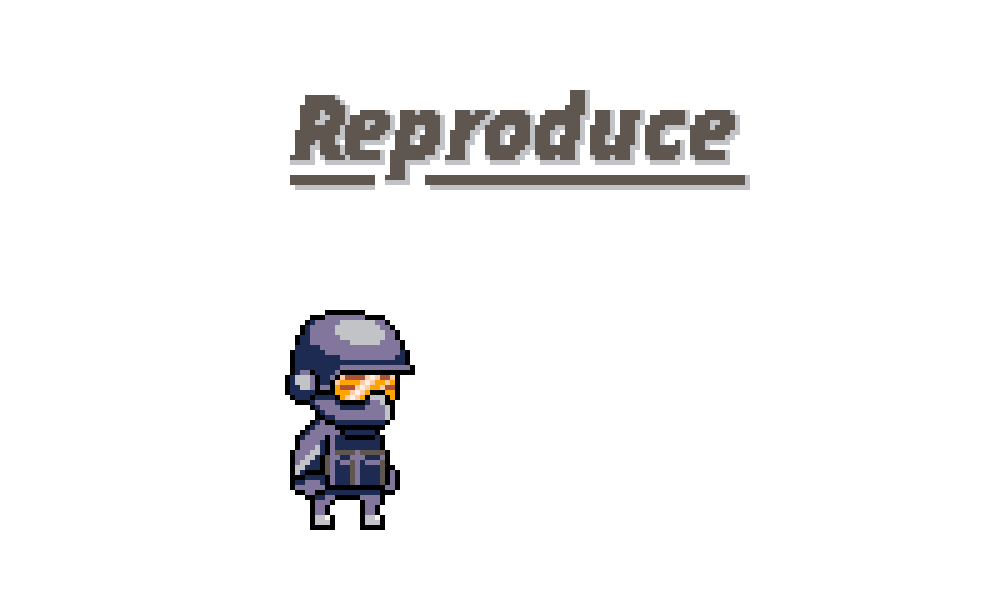
One of my first steps in debugging is to reproduce the bug in a controlled environment. I do this in order to confirm that the bug exists, and to isolate it given a minimum set of variables.
I reproduce bugs by ensuring that I accomplish the following in my project:
- Create a minimum working environment: this may include the version where the bug was discovered, dependencies, error/stack-trace, and a “minimal, complete verifiable example”. For my open-source work, I automate this using Github’s Issue templates.
- Setup my project so that it’s easier to reproduce parts of the code: I do this by pinning dependency versions, writing readable logs and error messages, and keeping an updated local dev setup instructions.
E is for Execute
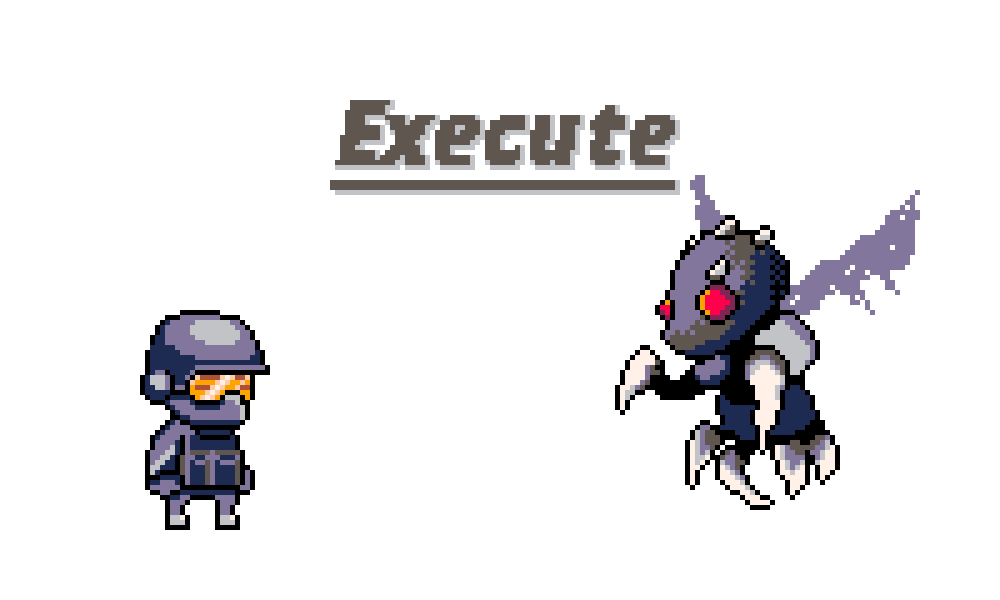
When I was still starting out, I immediately jump into this step and brute force my way into the debugging process. As I squashed more bugs in my career, I learned how to be tactical, thorough, and precise. There’s a logical reason why bugs happen, and it’s important to narrow-down what causes this behaviour.
There are three tools that helped me in this process: loggers, debuggers, and the test suite:
- Loggers provide more context on the bug: I setup my logger so that I know when the bug happened, what has happened, and where it happened in the source-code. For Python I use loguru and for Golang I use logrus.
- Debuggers enable me to inspect variables as I untangle the bug: this tool has some learning curve, but was made worth it as I don’t need to put a lot of
printstatements around my code (and more!). In Python, I simply use the built-in debuggerpdb. - Test suite makes me more defensive when debugging: before and after I debug, I ensure that the test suite passes. In addition, I found that it is important to setup a CI/CD system so that it’s easier for me to iterate along the way.
D is for Document
Documentation is one of the most important and forgotten parts of debugging—I know because I’m guilty! There are plenty of benefits in documenting code, some of these we may already know by now: easier for others (including future us) to read our code, good way to step-back from biz logic to more high-level thought, and keeps a history of our project.
I try to document bugs (and their fixes) by following these practices:
- Writing and running regression tests to document bug behaviour: these tests allow me to express the logic, in code, that causes the bug. Ideally, these tests shouldn’t break in the future whenever the business logic is updated.
- Ensuring that commit messages are detailed enough: I’m a big fan of Chris Beam’s tutorial on writing commit messages. As a practice, I describe in the commit the bug it’s trying to solve, and my thought process as to why these changes were done. In addition, I ensure that the Github/JIRA Issue was referenced in the commit.
- Keeping a Changelog: there are notable benefits for keeping a changelog. In the context of debugging, it documents on a high-level what bugs were fixed on a specific version of the software. I try to automate this as much as possible, but I also recommend writing it yourself!
Conclusion
In this blog post, I talked about my Code R.E.D. framework on debugging. It’s an acronym for a three-step process that I follow whenever I want to squash some bugs: R for Reproduce, E for Execute, and D for Document. I also explained some practices that I follow as I go through each step. You might notice that these guidelines are still rough, but I think that having a simple methodology on how to approach debugging is helpful.
Lastly, I hope that you enjoyed the Pixel art, and adopt the Code R.E.D. framework into your own workflows! If you wish to see more of my fledgling attempts in pixel art, follow me on my Twitter art account, @pixineries!
P.S. Here’s the full Pixel Art GIF!