
How to make a CanvasJS Chart from MySQL Data
For those who were redirected here from my Wordpress site, I would like to welcome you to my new blog! I will be moving some of my older posts here so that in the future, I can delete the Wordpress site entirely. Feel free to look around!
For one of my projects during my undergrad years, I am required to render graphical charts in our website using data found from MySQL. Today, everything is much easier for you can use various web frameworks such as Django and Ruby on Rails. But for some of us who still enjoy the XAMPP stack, this simple task can be quite daunting.
Back in those years, I am utilizing a Javascript library called CanvasJS. It is fast and easy, and is being used by different companies such as Intel, Boeing, and BMW. In this tutorial, I will teach you how two things, these are:
You might need a little bit of Javascript and PHP experience here (although Javascript is given if you’re doing web development), but I will provide some of the codes below. But first, in order to understand the bigger picture of what we’ll do, take a look at the diagram below:
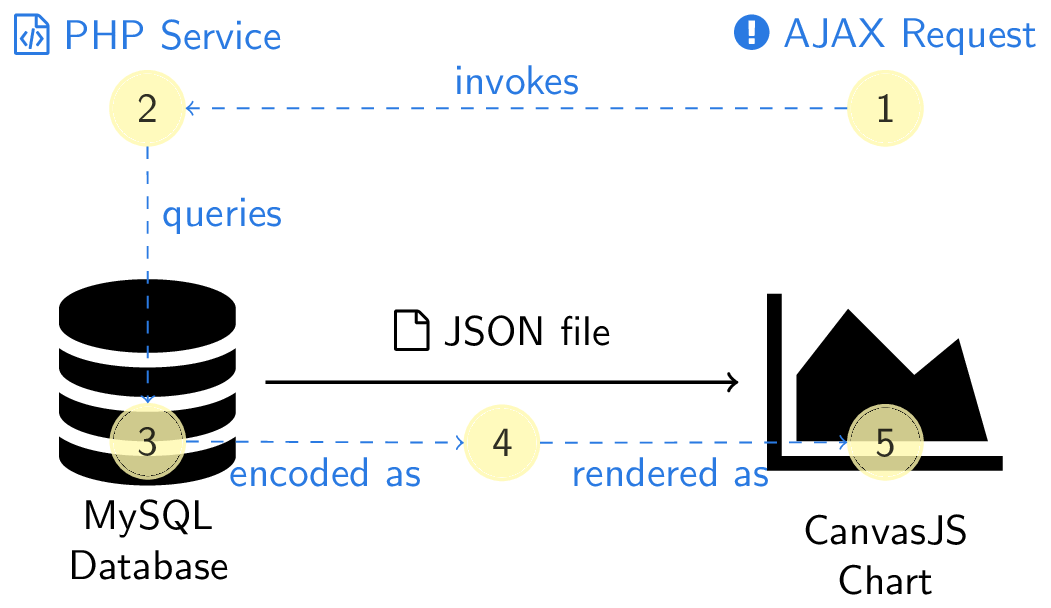
Let me first explain what we’ll do one-by-one:
- From our server, we will invoke an
AJAXrequest, typically agetJSON()command in order to access the PHP service that gets the data from our MySQL database. - This PHP service connects to the database and does lookup, select, and processing of our data. In summary, we put our SQL queries inside this PHP service to access our data. Moreover, this PHP service also prepares our data into JSON format.
- Once the PHP service is “activated,” the database will then churn out the necessary data, and through the PHP service send this JSON file into our server.
- The server then receives the data in JSON form and stores it in an object. For the sake of discussion, we call this object
result. - We treat
resultas an object where we can access different keys and values as how we normally treat JavaScript objects. In our case, we use this object to render a chart.
We do steps 1 to 3 in the first part, and 4 to 5 in the second part.
Receiving data from a MySQL Database
First, we invoke an AJAX request containing the PHP service required. The
structure of our request looks like this:
$.getJSON("myphpService.php", function(result){});
Here, myphpService.php contains the SQL queries that will be used to access
data from our database. Later on, this data will be stored in the object
result. Let’s then write our myphpService.php script:
<?php
/* We first connect to our database */
$connection = mysqli_connect($dbhost,$user,$password,$database,$port);

/* Capture connection error if any */
if (mysqli_connect_errno($connection)) {
        echo "Failed to connect to DataBase: " . mysqli_connect_error();
    }
else {

  /* Declare an array containing our data points */
   $data_points = array();

  /* Usual SQL Queries */
     $query = "SELECT `timeStamp`,`myData2` FROM `myTable`";
     $result = mysqli_query($connection, $query);

     while($row = mysqli_fetch_array($result))
        {
      /* Push the results in our array */
            $point = array("ts" =>  $row['timeStamp'] ,"d1" =>  $row['myData1']);
            array_push($data_points, $point);
        }

    /* Encode this array in JSON form */
        echo json_encode($data_points, JSON_NUMERIC_CHECK);
        }
    mysqli_close($connection);
?>
So as usual, we connect to our database using mysqli_connect(). What we
then do is that we declare an array containing our data points, and using SQL
queries, we store the desired data in the variable $result. We then push
everything inside our array, and encode the array in JSON form using
json_encode. Do not forget to close the connection once you’re done!
Take note! Be mindful that in practice, we don’t store our user credentials as variables in our script. You can check some of the good MySQLxPHP and general PHP practices in the links provided.
Using this script, we can now access data from our database. Note that we’re
just using very simple SQL queries such as SELECT and FROM. This can vary
depending on your needs, but the most important thing is that these values
are pushed into the $data_points array so that they can be encoded in JSON
form. The idea here is that through the getJSON command in our server, we
get to receive whatever the .json file the script outputs. It is very handy
in managing some of our data and very flexible as well.
Say that our PHP service is successful, the json object will then be stored
in result and can be manipulated through the callback function. You can
refer to the API documentation of .getJSON
here for more information. The idea
is that the callback function is executed once the request succeeds.
Take note! Another thing that you have to consider is to handle the error if the request didn’t succeed. I will not discuss about it here, for I will assume that our PHP service will always give the JSON object needed by our server. There are a lot of ways to handle errors, and I will refer you to this link to get you started in this.
Using the received data to make CanvasJS charts
Let’s look back again to our .getJSON command:
$.getJSON("myphpService.php", function(result){});
We now focus to our callback function. Remember that we store our JSON object
into result. In order to access and manipulate that object (or in our case,
to make charts out of it), we should write code inside the curly brackets of
our callback function.
Thus, inside our callback function, we can write something similar as:
$.getJSON("myphpService.php", function(result){
var dps= [];

//Insert Array Assignment function here
for(var i=0; i<result.length;i++) {
    dps.push({"label":result[i].ts, "y":result[i].d1});
}

//Insert Chart-making function here
var chart = new CanvasJS.Chart("chartContainer", {
    zoomEnabled:true,
    panEnabled:true,
    animationEnabled:true,
    title:{
        text: "myChart from mySQL database"
    },

    axisX:{
        title: "TimeStamp"
    },

        axisY:{
        title: "myDataPoints",
        minimum: 0
    },

    data: [{
        type: "spline",
        dataPoints:
            dps
              }]
});
chart.render();

});
First, we process our result object by pushing it into an array dps. We
do this by iterating over the length of the result object, and pushing it
into a dictionary-like array given the following keys that we have in our
JSON file. Afterwhich, we can simply invoke the chart-making function via
CanvasJS.Chart and proceed with the necessary code.
I hope that I was able to shed light on this subject more clearly. If you have any questions, don’t hesitate to comment below!
Changelog
- 01-27-2019: Turn divs into quotes for “Take note!”
- 10-04-2018: Update figures using Tikz for consistency