
Exploratory Data Analysis: Energy Use in the Philippines
This was my very first data science project (circa 2016). You can find the original post in Kaggle.
I am investigating the country’s energy use given the World Development Indicators dataset provided here in Kaggle. I am particularly interested to how the Philippines has been performing over time, as well as how it performs compared with its South-East Asian Neighbors. If you have any questions or suggestions, do not hesitate to reach me through the comments below. I would like to hear and learn from you!
- What percentage of the population has access to electricity?
- What constitutes my country’s energy mix?
- How are we consuming our energy?
- Conclusion
Access to electricity
The charts below show the percentage of the urban and rural population with access to electricity and the comparison of the country’s performance with its neighbor south-east Asian nations.
Access to electricity over time
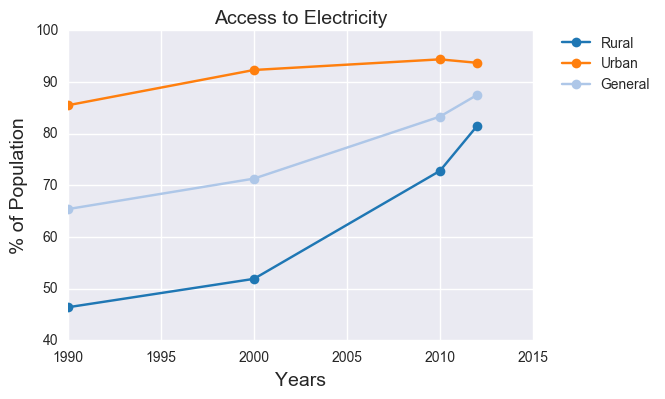
The chart above shows the population’s access to electricity over a period of 20 years. Although there was a sharp division of resources in the 90s, access to this need is being resolved as time progresses. It is commendable that the government (as well as the private companies) has started putting effort to provide electricity to rural communities at the onset of the millenium.
It is also interesting to note that the years with a steeper slope started in 2010, and this can be credited to the previous administration (and the corresponding electricity conglomerates) for continuing the steep rise done in the previous years.
SEA Comparison
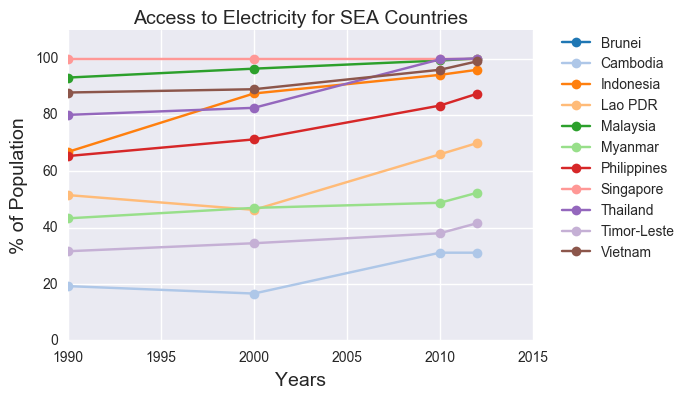
One can observe that both Philippines and Indonesia started out similarly in the 90s, yet because of the steepness of Indonesia’s slope in the chart, it was able to follow the leading countries—even overtaking Thailand in the year 2000. However, it may also be important to investigate the state of these countries before 1990s in order to see how this progression came to be.
Top-performing countries in achieving the goal of universal access to electricity are Singapore, Malaysia, and Thailand. Achieving almost a 100% by the turn of 2012. Singapore, on the other hand, is a consistent performer, allowing its population to have access to electricity for 20 years.
Energy Mix
Equally important in understanding the country’s energy use is to know where our energy is being sourced from. This section will look into the different sources of energy—fossil fuels (coal, natural gas, petroleum), hydroelectric, and renewable in order to gain insight to where most of our electricity is coming from.
Moreover, a comparison with the SEA top-performers (in terms of providing electricity access) will be done in order to assess where the huge bulk of the electricity\textemdash that they are sourcing effectively to the population—is coming from.
Lastly, it is also important to investigate the country’s adoption to renewable energy, and compare this with our SEA neighbors. This can help identify trends, especially that using fossil fuels contributes much to our carbon footprint—given the devastating results of global warming and climate change.
Energy Mix in the Philippines
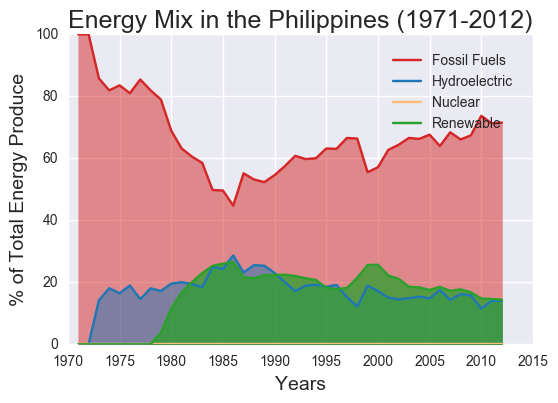
It is evident that the country is still reliant to fossil fuels as a main source of energy. Hydroelectric easily caught up and is a stable source to the fifth of our energy supply in the country. Interestingly, the contribution of renewable energy in the country is comparable to that of hydroelectric— and by combining the two together, one can see that these “clean” sources of energy contributes more than a fourth of our total energy mix.
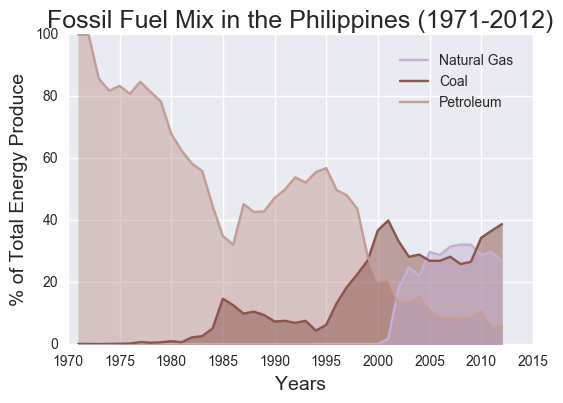
Looking at the country’s fossil fuel mix, one can see that our use of petroleum has significantly dropped for the last 20 years. This has been replaced by other fossil fuels such as natural gas (during the 1980s) and coal (during the 2000s).
Comparison to SEA Neighbors
This section looks into the position of the Philippines with respect to the use of fossil fuels and the adoption of renewable energy through time.
Fossil Fuel Use
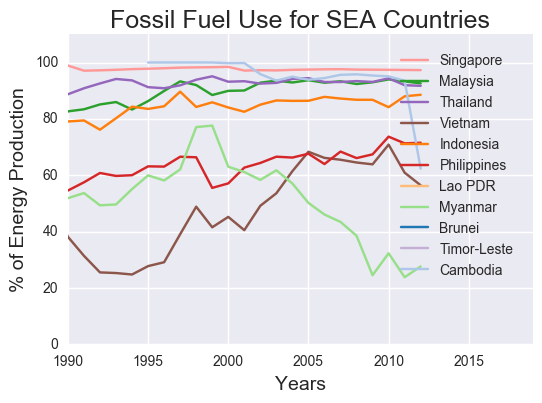
The use of fossil fuel in the energy mix is shown in the figure above. It is interesting that the top-players in providing access to electricity in their respective population—Singapore, Thailand, and Malaysia—are sourcing their energy mostly from fossil fuels.
The Philippines, on the other hand, is fourth from below in the level of fossil fuel that constitutes the energy mix. The first in this list is Myanmar, where fossil fuel constitutes 20 to 40% of the energy mix.
Renewable Energy Adoption
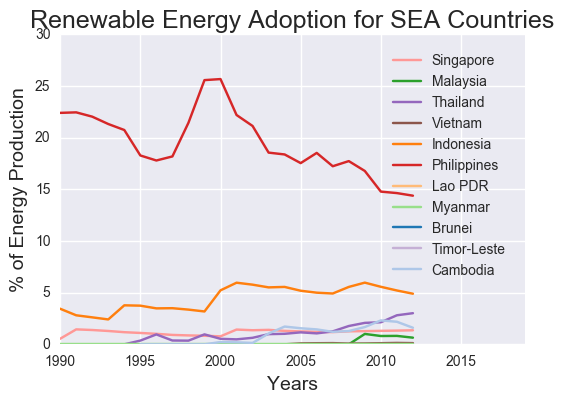
The figure above shows the renewable energy adoption of different SEA countries over time. It is interesting to note that the Philippines is leading the renewable energy race, then followed by Indonesia and the rest of the SEA countries.
Energy Consumption
With the knowledge of the country’s energy sources, the next step is to un- derstand how we consume that energy. This section will first look into the country’s electric power consumption over time, then look at our consump- tion footprint—particularly that of carbon emissions and other greenhouse gases.
Electric power consumption over time
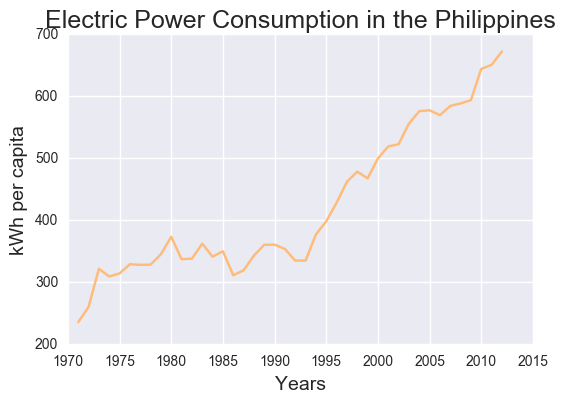
It can be observed from the chart above that the power consumption in the country has increased from about 200 kWh to 700 kWh over time. It is expected that this consumption will increase, and this corresponds to unprecedented effects in our environment; as we continue utilizing different sources for our electricity use.
Consumption footprint
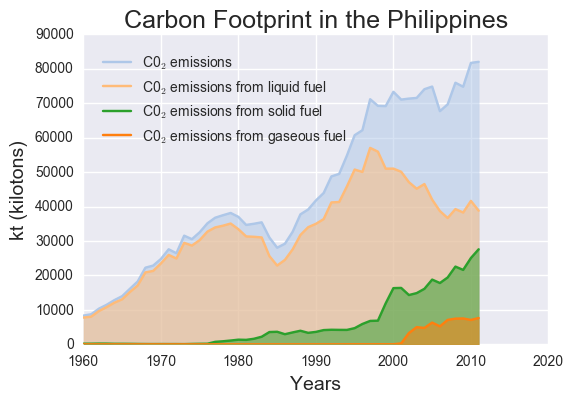
These unprecedented effects are what we often call as our consumption foot- print, for it leaves traces in nature that we may not expect. This section will look into our carbon footprint and different greenhouse gases, taken mainly from our use of fossil fuels as energy source, and through our continued consumption of electricity (managed or not).
Similar to the rise of our electric consumption, our carbon footprint has increased steadily for the last few years. Different sources have contributed to this, the first mainly by liquid fuel, then followed by solid fuel and then by gaseous fuel. It is expected that this trend will continue to rise, and its effects might be felt if left unmitigated.
Conclusion
This report looks into World Bank’s World Development Indicators in order to understand the energy situation in the Philippines. Three aspects were considered|the access to electricity of the population, the energy mix, and the energy consumption and footprint.
The country’s access to electricity is being resolved through time, increasing the rural population’s access for the last twenty years. However, much work is to be done, for the country is only 6th compared to its SEA neighbors in this category. However, much can be said in the country’s energy mix, for the use of fossil fuels (although still in majority) is being offset by hydroelectric and renewable sources of energy. In fact, the country is leading among its SEA neighbors with respect to the renewable energy adoption. Lastly, the electricity consumption of the country is still on the rise, and will still be, given the trend for the last twenty years. This can then be followed by an increasing carbon footprint, which may lead to unprecedented effects if left unmitigated.
Changelog
- 06-11-2018: Add original Kaggle link